Brent E. Huntsman and Roger W. McCready
Terran Corporation
4080 Executive Drive
Beavercreek, Ohio 45430-1061
Abstract
Passive monitoring is the simple measurement of an aquifer's response to a naturally induced water level fluctuation. Origins of naturally induced fluctuations useful in passive monitoring include earth tides, episodic changes in recharge or discharge, or shifts in barometric pressure. By measuring water level changes in response to these fluctuations, it is possible to estimate the aquifer's hydraulic properties. As a case study, the passage of a river flood wave was used to calculate diffusivity values of an unconfined buried valley aquifer. Values for diffusivity calculated from these passive measurements compared well with those determined using standard (active) aquifer testing techniques. Results from this study suggest properly designed long-term water level monitoring networks can be a cost effective alternative when determining aquifer characteristics in the appropriate hydrogeologic setting.
Introduction
The determination of aquifer flow properties is essential to many hydrogeologic investigations. A variety of techniques have been developed over the past century to test and measure such subsurface characteristics as storativity, hydraulic conductivity, porosity, elasticity, and others. Some of the more common tests include laboratory permeameter measurements, single well slug tests, single well packer tests and multiple well pumping tests. All of these tests actively inject or extract fluids from the porous media while measuring the resulting change to subsurface water levels.
Natural forces also can cause changes in subsurface water levels. By simple measurement of an aquifer's response over time to naturally induced water level fluctuations, many subsurface flow properties can be quantified using modest analytical equations. This we will refer to as passive monitoring techniques. Natural processes which provide useful water level changes will be discussed in the following section. As with other hydrogeologic assessment techniques, the success of passive monitoring is strongly dependent upon the geologic setting and to what degree the underlying assumptions of the analysis methods have been satisfied. When applicable, the use of passive monitoring offers several unique advantages when compared to active test methods.
One unique advantage of passive monitoring is the scale at which the natural stress is applied and the resulting area of water level response in the aquifer. While laboratory tests determine flow characteristics in distances of centimeters (inches), single well tests measure properties in distances of tens of centimeters (inches to feet), and multiple well tests determine subsurface parameters in distances of tens of meters (yards), passive monitoring water level fluctuations can represent hydraulic properties averaged over a distance of kilometers (miles).
An equally important advantage of using passive monitoring techniques is lower costs when compared to many active tests, especially when the investigation is in a contaminated media. Typically, only water level changes are measured in the aquifer. This limits equipment requirements to standard data loggers and transducers, water level recorders, and ullage tapes. If properly designed, a passive monitoring network of wells and piezometers can consist of existing or required water quality monitoring wells. The need for pumps, external power, or disposal of investigation-derived waste is minimized or eliminated.
Probably the most common disadvantage to passive monitoring techniques is the need for observations in water level changes over long periods of time. This is necessary to correctly correlate water level changes with the natural process creating the stress to the subsurface units. Many passive monitoring analytical techniques require regularly spaced water level data gathered over weeks or months.
Natural Process Useful for Passive Monitoring
Natural processes affect subsurface water levels by volumetric change, either by fluid exchange or aquifer matrix deformation. Some natural process which have sufficient water level fluctuations to calculate subsurface flow properties are tabulated below.
Changes in Recharge
- Seasonal Infiltration
- Episodic Flooding
Changes in Discharge
- Water-Level Recession
- Evapotranspiration
Tidal Effects
- Solid Earth Tides
- Ocean Tides
Changes in Atmospheric Loading
- Barometric Effects
- Wind Effects
Depending upon the local geology and the magnitude of the natural force, useful water level changes may vary from centimeters (inches) to meters (yards) from these natural processes.
To provide an example of how an aquifer's diffusivity (transmissivity/storativity) was determined by using a passive monitoring to measure the change in recharge caused by a episodic flooding event, the following case study is presented.
Case Study
Site Hydrogeology
A passive monitoring technique was used to characterize the hydrogeologic system of a facility under the CERCLA program. The hydrogeologic setting at and near this facility consists of bedrock valleys partially filled with unconsolidated glacial and alluvial deposits. The facility is predominantly positioned on a bedrock high. Bedrock in the area is a layered sequence of shale and limestone. Because preglacial and interglacial valleys in the bedrock of the region are filled with outwash and till, these valleys are categorized as "buried valleys". Groundwater in the area is found in the bedrock and the buried valleys. The porous and permeable buried valleys contain large and productive aquifers which have significantly more ground-water for development than the bedrock, and are the region's primary drinking water supply. The buried valley aquifer (BVA) near the site underlies the present day Great Miami River (GMR). The dynamics of the GMR and the BVA show a high degree of interaction.
Water Level Monitoring Network
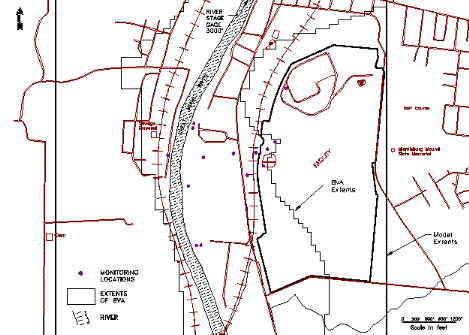
A study was conducted from May 1993 to May 1994 to continuously monitor the fluctuation of BVA water levels, GMR stage, barometric pressure, and precipitation. This study utilized a total of 18 continuous monitoring locations: 13 piezometers and 3 monitoring wells within the BVA, one piezometer in a perched zone of a tributary valley on the facility, and a monitoring well on the facility's main hill. As illustrated in Figure 1, these water level monitoring locations extended eastward from the GMR for a distance of 732 meters (2400 feet) onto the facility. Great Miami River stage data from a USGS gage located 915 meters (3000 feet) upstream was also used to monitoring GMR stage.

Figure 1. Water level monitoring locations.
From November 13 to 17, 1993, 12.17 centimeters (4.79 inches) of rainfall occurred in the Great Miami River basin. Runoff from this rainfall event was first observed in the Great Miami River (GMR) at locations near the site on November 13. On November 18, 1993 the river crest near the site reached a height of 1.8 to 2.1 meters above the pre-rainfall river stage. Increased groundwater level were recorded at 17 monitoring locations. The observed water levels suggested that a passive monitoring technique could be applied to this data to determine aquifer characteristics of the BVA.
Floodwave Propagation Analysis
The rise in river stage produced by the November 1993 rain events sent a floodwave to the lateral boundaries of the BVA. By comparing the fluctuation of river stage to a simple harmonic motion, Ferris (1951) developed a method of computing the ratio of transmissivity to storativity (T/S or diffusivity) of an aquifer. Using this technique, the November 1993 flood wave event was analyzed to obtain a better understanding of aquifer properties and their distribution in the BVA adjacent to and underlying the site.
Time-Lag Technique
Ferris' (1951) technique of computing aquifer diffusivity is based on the lag in time between occurrence of a given stream maximum or minimum and its appearance in an observation well (Time-Lag Method). One assumption implied in the Ferris method is that the stream fully penetrates the aquifer, or the observation well is sufficiently distant from the river to be unaffected by vertical flow components. Water level changes in the aquifer observation wells must be the result of the addition or subtraction of water to the river, not merely a reflection of changes in aquifer loading caused by fluctuation in river stage. Other specific assumptions made by Ferris included:
- the aquifer is homogenous and of uniform thickness,
- the aquifer is of great areal extent shoreward
- that is normal to the strike of the suboutcrop,
- water in the aquifer is released immediately and proportionally to the surface water level increase or decline,
- in unconfined aquifers the range of cyclic variation in the observation well is only a small fraction of the saturated thickness of the aquifer.
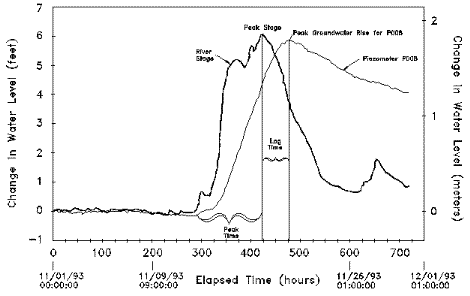
In applying the time-lag technique of analysis, the elapse time periods between the occurrence of the crest in river stage and the arrival of peak water levels in the observation wells are compared (Figure 2).

Figure 2. Graph of peak water levels in the river and the observation wells.
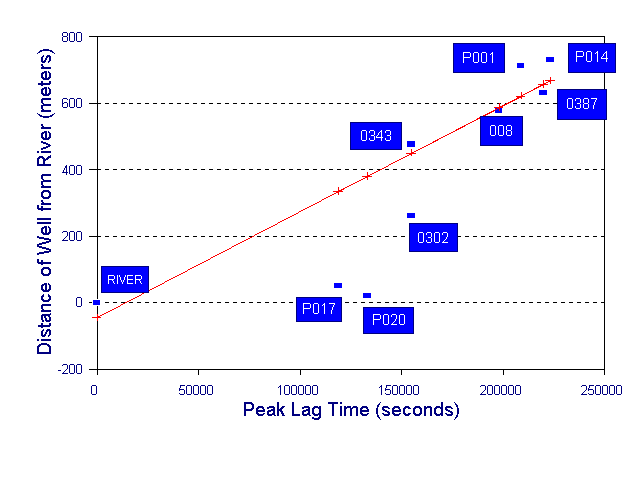
A representative aquifer response lag time relationship was obtained by plotting eight observation well peak lag times on a arithmetic coordinate axis versus the respective distances between the wells and the river.

Figure 3. Graph of peak lag times and distances between the well and the river.
To calculate diffusivity, the following equation is used:
![]() (1)
(1)
where:
T = transmissivity in m²/s
S = storativity, dimensionless
T/S = aquifer diffusivity in m²/s
X = effective distance from the observation well to the surface water source in meters
to = period of full range of river stage fluctuation in seconds
t1 = time lag between maximum river stage and maximum groundwater stage in seconds
Diffusivity was calculated using this method for monitoring location P008. Piezometer P008 is 579 meters (1900 feet) from the GMR. River stage crested within 129 hours (464,400 seconds) after a uniform stage. A lag time 57.5 hours (207,000 seconds) was measured between the time the river crested and the groundwater level in P008 peaked (Figure 2). Eight other locations were used to determine the regression distance for P008. Excluding the two observation wells closest to the river, the calculated diffusivity at P008 was 0.65 m²/s (7.0 ft² /s or 4.5 million gallons/day/foot). The diffusivity calculations for the time-lag method for the eight observation wells do not provide a unique value of T or S. For each well, a range of storativity values was assumed and corresponding transmissivity values were calculated.
Time-Lag Method Calculations
Linear regression calculations for the representative aquifer response lag time relationship
| Well Number | Distance to River (meters) |
Peak Time (seconds) |
Time Lag (seconds) |
Regression Distance (meters) |
| River | 0 | 1519200 | 0 | -45 |
| 0343 | 477 | 1674000 | 154800 | 450 |
| 0387 | 631 | 1738800 | 219600 | 657 |
| PO14 | 730 | 1742400 | 223200 | 669 |
| P008 | 579 | 1717200 | 198000 | 588 |
| P001 | 713 | 1728000 | 208800 | 623 |
| 0302 | 261 | 1674000 | 154800 | 450 |
| PO20* | 21 | 1652400 | 133200 | 381 |
| PO17* | 52 | 1638000 | 118800 | 335 |
* Note: Not used in calculating regression line due to suspected turbulent flow in the aquifer during flooding.
Regression Output:
| Constant | -45.18692 | |
| Std Err of Y Est | 101.15256 | |
| R Squared | 0.880364 | |
| No. of Observations | 7 | |
| Degrees of Freedom | 5 | |
| X Coefficient(s) | 0.0032 | |
| Std Err of Coef. | 0.00053 |
Diffusivity calculations for Monitoring Well P008
| Allow: T = (S x² to)/(tl² 4pi) and K = T/b | |
| If x | = 588.26 (Note: Selected distance, in meters, from river.) |
| If to | = 928800.00 (Note: rise time of flood wave in the river was 464,400 seconds (129 hrs). Multiply by 2 for peak decline 928,800 seconds) |
| If tl | = 197856.00 seconds |
| If b | = 9.14 meters |
| Then, for these values, T/S = 0.65 m²/s | |
where:
| b | = thickness of the saturated aquifer at well in meters | |
| x | = distance from the river in meters (from regression) | |
| to | = period of uniform stage in seconds | |
| tl | = observed flood peak lag time in seconds | |
| pi | = 3.14159 | |
| T | = transmissivity in m²/s | |
| S | = storage coefficient (dimensionless) | |
| T/S | = diffusivity in m²/s | |
| K | = hydraulic conductivity in m/s |
Transmissivity and hydraulic conductivity calculated from assumed storativity values
| If S is: | Then T equals: | Then K equals: |
| 0.001 | 6.53E-04 m²/s | 7.15E-05 m/s |
| 0.002 | 1.31E-03 m²/s | 1.43E-04 m/s |
| 0.003 | 1.96E-03 m²/s | 2.14E-04 m/s |
| 0.004 | 2.61E-03 m²/s | 2.86E-04 m/s |
| 0.005 | 3.27E-03 m²/s | 3.57E-04 m/s |
| 0.006 | 3.92E-03 m²/s | 4.29E-04 m/s |
| 0.007 | 4.57E-03 m²/s | 5.00E-04 m/s |
| 0.008 | 5.23E-03 m²/s | 5.72E-04 m/s |
| 0.009 | 5.88E-03 m²/s | 6.43E-04 m/s |
| 0.01 | 6.53E-03 m²/s | 7.15E-04 m/s |
| 0.02 | 1.31E-02 m²/s | 1.43E-03 m/s |
| 0.03 | 1.96E-02 m²/s | 2.14E-03 m/s |
| 0.04 | 2.61E-02 m²/s | 2.86E-03 m/s |
| 0.05 | 3.27E-02 m²/s | 3.57E-03 m/s |
| 0.06 | 3.92E-02 m²/s | 4.29E-03 m/s |
| 0.07 | 4.57E-02 m²/s | 5.00E-03 m/s |
| 0.08 | 5.23E-02 m²/s | 5.72E-03 m/s |
| 0.09 | 5.88E-02 m²/s | 6.43E-03 m/s |
| 0.10 | 6.53E-02 m²/s | 7.15E-03 m/s |
| 0.11 | 7.18E-02 m²/s | 7.86E-03 m/s |
| 0.12 | 7.84E-02 m²/s | 8.58E-03 m/s |
| 0.13 | 8.49E-02 m²/s | 9.29E-03 m/s |
| 0.14 | 9.14E-02 m²/s | 1.00E-02 m/s |
| 0.15 | 9.80E-02 m²/s | 1.07E-02 m/s |
| 0.16 | 1.05E-01 m²/s | 1.14E-02 m/s |
| 0.17 | 1.11E-01 m²/s | 1.21E-02 m/s |
| 0.18 | 1.18E-01 m²/s | 1.29E-02 m/s |
| 0.19 | 1.24E-01 m²/s | 1.36E-02 m/s |
| 0.20 | 1.31E-01 m²/s | 1.43E-02 m/s |
| 0.21 | 1.37E-01 m²/s | 1.50E-02 m/s |
| 0.22 | 1.44E-01 m²/s | 1.57E-02 m/s |
| 0.23 | 1.50E-01 m²/s | 1.64E-02 m/s |
| 0.24 | 1.57E-01 m²/s | 1.72E-02 m/s |
| 0.25 | 1.63E-01 m²/s | 1.79E-02 m/s |
| 0.26 | 1.70E-01 m²/s | 1.86E-02 m/s |
| 0.27 | 1.76E-01 m²/s | 1.93E-02 m/s |
| 0.28 | 1.83E-01 m²/s | 2.00E-02 m/s |
| 0.29 | 1.89E-01 m²/s | 2.07E-02 m/s |
Evaluation of Floodwave Propagation Results
In addition to the "passive" method of using a river flood event to calculate representative diffusivity values for the BVA, numerous "active" aquifer tests have been conducted in the BVA near this site. Over 100 individual analyses for transmissivity and storativity have been performed. From these analyses the average transmissivity was 0.14 m²/s ( 1.51 ft²/s) with a minimum of 0.02 m²/s (0.22 ft²/s) and maximum of 0.34 m²/s (3.66 ft²/s). An average calculated storativity value from these analyses was 0.1 with a minimum of 0.0006 and maximum of 0.28. A diffusivity calculated from the average transmissivity and storativity is 1.4 m²/s (15.07 ft²/s). Based on paired analyses of transmissivity and storativity the average diffusivity calculated was 0.9 m²/s (9.69 ft²/s). The values determined by the time-lag method of the November, 1993 floodwave are in good agreement with those reported from aquifer test analyses for this area.
For confirmation of these results, three additional floodwave events of various magnitudes were analyzed. Two events, July 1993 and April 1994 were of similar magnitude and duration as the November 1993 event. The time-lag method result for the July 1993 event was a diffusivity of 0.56 m²/s (6.03 ft²/s) and in April 1994 the calculated diffusivity was 0.61 m²/s (6.57 ft²/s), as compared to the November, 1993 diffusivity of 0.65 m²/s (7.0 ft²/s). A floodwave event in January, 1994 was longer in duration and had a 0.3 meter (1.0 feet) higher peak stage. Based on the time-lag method the diffusivity was calculated to be 1.39 m²/s (14.96 ft²/s) which is approximately twice the value of the other three events but within the same order magnitude. The close correlation between results of the "active" aquifer tests and the "passive" floodwave method corroborate the validity of this passive method. Additionally, the repeatability of results obtained from successive trials of the passive method attest to the scientific usefulness of this method.
Conclusions
An analytical method has been applied to data collected from a passive monitoring program to determine the aquifer characteristics of a buried valley aquifer. A long term water level monitoring program determined the groundwater fluctuations with respect to a river stage floodwave. The time-lag method developed by Ferris (1951) was used to calculate the diffusivity of a buried valley aquifer based on one floodwave event. Diffusivity calculated by this method agree within 50 percent of an average diffusivity calculated from over 100 individual aquifer test analysis for the area. Several other floodwave events were analyzed for comparison. Floodwaves produced from similar stage rises and duration produced diffusivities within 10 percent.
The use of the time-lag method and passive monitoring has been successful in this hydrogeologic setting to calculate aquifer characterization parameters. This approach may serve to obtain information concerning aquifer characteristics at locations in the BVA far removed from aquifer test sites by simply recording river stage and ground water level changes.
The concept of using passive monitoring to determine subsurface flow characteristics is uncommon in many of today's hydrogeologic assessments. Natural processes can and do create sufficient water level changes to determine average flow properties over large aquifer areas. With the proper consideration of well placement and site geology, passive monitoring techniques can be a cost effective alternate.
References
Ferris, J.G. 1951. "Cyclic Fluctuations of Water Levels as a Basis for Determining Aquifer Transmissibility", International Union of Geodesy and Geophysics, Assoc. Sci. Hydrology Assembly, Brussels V.2:148-155.
Bibliographic Sketches
Brent E. Huntsman, chief hydrogeologist and founder of Terran Corporation, an environmental consulting firm in Dayton, Ohio US. Mr. Huntsman has twenty years experience of applying multi-disciplinary concepts to solving environmental problems. Prior to forming Terran Corporation in 1984, Mr. Huntsman was senior hydrogeologist for Monsanto Company and served as project director of Brehm Laboratory at Wright State University. Mr. Huntsman received his B.S. degree in Geology from Kent State in 1973 and M.S. degree from Wright State University, Dayton, Ohio 1975.
Roger W. McCready is a project manager and hydrogeologist for Terran Corporation. He received his B.S. and M.S. degrees from Wright State University in 1985 and 1994. Mr. McCready has 8 years experience performing hydrogeologic investigation design and implementation, investigation data analysis and numerical simulation of environmental and groundwater problems. Projects for which he has been responsible have been with commercial, municipal and government clients.
This paper was originally presented and is published in the proceedings of:
International Association of Hydrogeologists Congress
June 4-10, 1995
Edmonton, Alberta, Canada
